
Figure 4. Con-A does not affect GluR6 dose-response relationships.
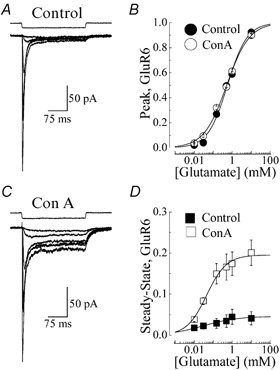
A and C, typical membrane currents elicited by l-glutamate (5 μm-10 mm, VH=−20 mV, 250 ms duration) in the same recording (patch no. 001002p1) before (A, peak EC50= 458 μm, nH= 0.91) and after (C, peak EC50= 512 μm, nH= 0.78) treatment with 10 μm Con-A. B and D, peak and steady-state GluR6 dose-response relationships observed prior to (filled circle or square, n= 6) and following (open circle or square, n= 5) Con-A treatment and fitted with the logistic equation (continuous lines): R=Imax/(1 + EC50/[agonist]nH) where R is the peak or steady-state response at a given agonist concentration, Imax is the maximum response and nH denotes the Hill coefficient. To allow comparison amongst different patches, peak and steady-state amplitudes were normalized with Imax values obtained from fits of individual dose-response relationships. Response rundown was not appreciable in control and Con-A-treated patches. However, to minimize this effect, all dose-response relationships were constructed by alternating between high and low agonist concentrations. All data are expressed as the mean ±s.e.m.