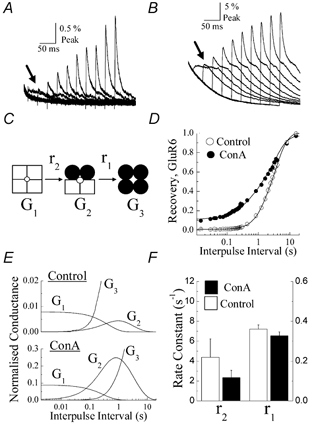
Figure 6. Con-A shifts the relative contribution of conducting states.

A and B, ten normalized test responses taken from Fig. 5A and detailed to show their temporal profile before (A) and after (B) Con-A treatment. Note that during the early phase of the recovery process in both cases, test responses re-enter desensitization with slower kinetics (see arrows). C, schematic showing only the recovery steps in the dimer model of GluR6 desensitization. G1, G2 and G3 are the macroscopic conductances associated with different states of the kinetic model and r2 and r1 are the rate constants that describe the rate of recovery from desensitization. The transition steps that lead from state G3 to state G1 have been omitted since Con-A treatment did not affect GluR6 desensitization kinetics (see Fig. 2). D, data from Fig. 5B re-fitted assuming that GluR6 receptors recover from desensitization in two sequential steps as shown in C. E, plots summarizing the contribution of conducting states G1-G3 to the macroscopic response at a range of interpulse intervals in control conditions (upper panel) and following Con-A treatment (lower panel). Note that the scale of the ordinate axis in the lower plot is an order of magnitude larger. F, summary plot showing the values of rate constants r1 and r2 estimated from fits of control and Con-A data shown in D.
