
Figure 2. Fluorescent FM 1–43 spotted pattern of Retzius neurones.
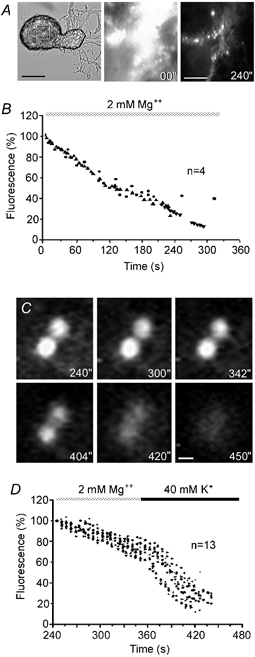
A, phase contrast of a Retzius neurone and fluorescence images of the selected area of the soma membrane at different times after electrical stimulation with a 20 Hz train in the presence of FM 1–43. Fluorescence images were taken at the beginning (00′′) and after 240 s of perfusion with Mg2+ solution. Washing the non-specific FM 1–43 staining off the membrane revealed fluorescent spots. Scale bars represent 60 μm (phase contrast) and 10 μm (fluorescence), respectively. B, decay of fluorescence in selected somatic membrane areas of 4 neurones during perfusion with Mg2+ solution to wash off non-specific FM 1–43 staining. Series of data from 4 neurones are superimposed. C, fluorescent FM 1–43 spots imaged at different times during perfusion with Mg2+ solution (top three images) and during depolarisation with 40 mm K+, 10 mm Ca2+ solution (bottom three images). Depolarisation in the presence of Ca2+ destained the fluorescent spots rapidly. The times shown are contiguous with those in A and B. Scale bar represents 1 μm. D, decay of FM 1–43 fluorescence intensity during superfusion with Mg2+ solution followed by depolarisation with 40 mm K+, 10 mm Ca2+ solution. The perfusion protocol is above. Series of data from 12 spots in 3 neurones are superimposed.