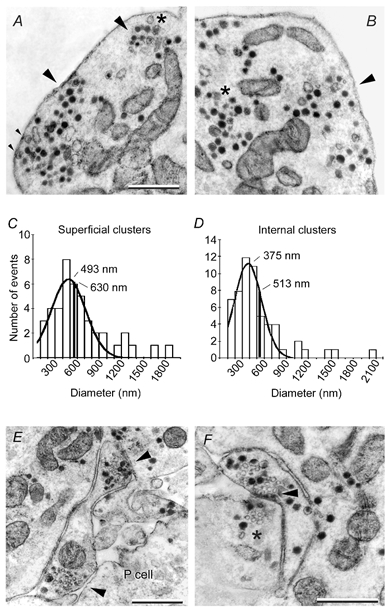
Figure 3. Subcellular distribution of structures possibly representing secretory organelles.

A, electron micrograph showing subcellular somatic clusters of dense core vesicles (arrowheads) and mitochondria. Clusters near the cell membrane with vesicles making contact with it are marked with small arrowheads. Presynaptic densities were absent. A large clear vesicle is marked with an asterisk. B, in addition to the vesicle clusters near the cell membrane (arrowhead) other clusters were at a distance from it (asterisk). Scale bar in A also applies to B. C, diameter distribution of superficial clusters. The continuous line is a Gaussian fit to the data with a mean value of 493 ± 35 nm. The black vertical line is the average diameter of the whole population. D, similar analysis for clusters at distances larger than 150 nm from the cell membrane. E, micrograph of the contact region with a pressure sensory (P cell) neurone showing a process of the Retzius neurone with two groups of clear and dense core vesicles near the cell membrane (arrowheads). F, autapse formed by a process and the stump of a Retzius neurone. A dense presynaptic zone with clear and dense core vesicles (arrowhead) is in close apposition to the cell membrane. A cluster of vesicles in the stump is marked with an asterisk. Scale bars represent 1 μm in all cases.
