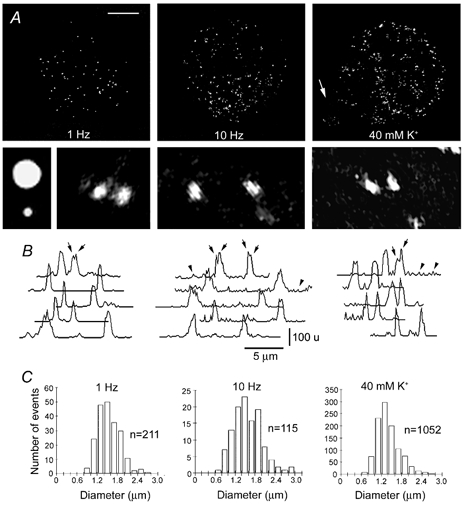
Figure 4. FM 1–43 staining patterns of Retzius neurones.

A, confocal three-dimensional (3-D) reconstructions of Retzius neurones stimulated in the presence of FM 1–43. The stimulation protocol is stated in each image. The arrow points to the stump. Scale bar represents 30 μm. Below are shown (left to right) amplified fluorescence images of fluorescent beads with 2.0 and 0.5 μm diameters and FM 1–43 spots of the neurones stimulated with each protocol. Note the asymmetries of the spots. B, light intensity profiles of several spots in each of the neurones above. The top traces correspond to the spots shown in the images. Different light intensity peaks in each spot were common (arrows). Intensities are in an arbitrary 256 unit (u) grey scale. Note the increase of the baseline noise in the profiles of neurones stimulated with 10 Hz and with high K+ (arrowheads). C, histograms of the diameter distribution of FM 1–43 spots obtained from confocal images of different cells stimulated with each protocol.
