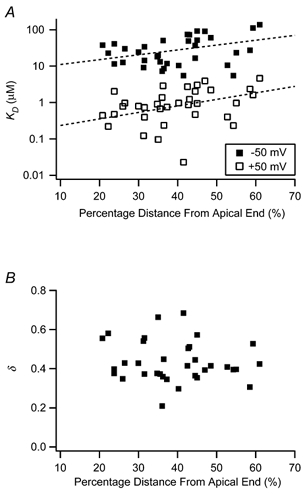
Figure 3. Calcium binding parameters along the sensory epithelium.

A, calcium sensitivity is plotted at holding potentials of −50 mV and +50 mV. These data were derived from logarithmic fits to V1/2-[Ca2+] curves, predicted by a two-state model. In many cases, it was necessary to extrapolate from these fits to estimate KD (23 % of patches for −50 mV and 42 % for +50 mV). The calcium concentration required for half-activation near the resting potential of the hair cell membrane ranges between approximately 5 and 100 μm. Dashed lines indicate exponential curve fits to the data of the form KD=A exp((%DAE)/B), where %DAE is the percentage distance from the apical end. Fit parameters: for +50 mV, A= 0.16, B= 24.3; for −50 mV, A= 8.2, B= 32.7. B, the energy consumed in the calcium binding process (δ) was estimated from the two-state model fits. This parameter was not tonotopically distributed.
