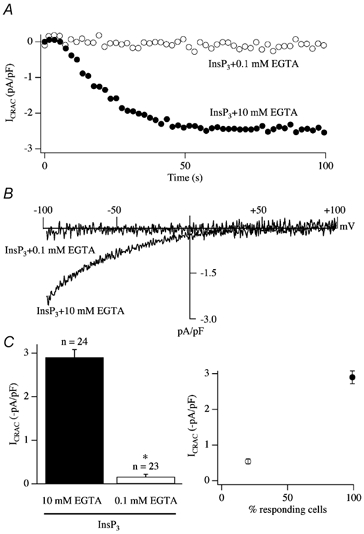
Figure 3. The weak buffer paradox.

A, InsP3 generally fails to activate ICRAC in weak intracellular Ca2+ buffer (0.1 mm EGTA) whereas it is effective in strong buffer (10 mm EGTA). B, current-voltage relationships for the two recordings from A, taken at steady state. C, the mean amplitude of ICRAC (left-hand panel) and the fraction of cells responding (right-hand panel) for each condition is shown. In this and all subsequent figures, data from RBL-1 cells are shown. *P < 0.01.
