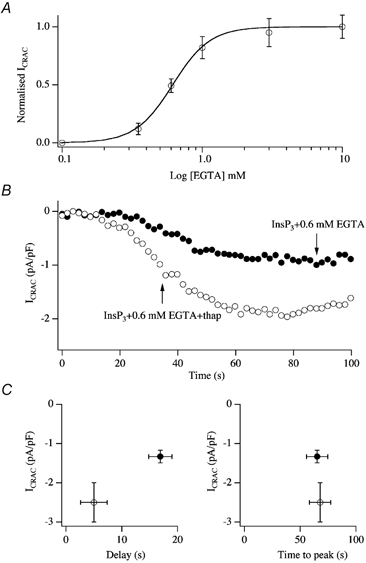
Figure 7. SERCA pumps function in the presence of InsP3.

A, the relationship between intrapipette EGTA concentration and amplitude of ICRAC (evoked by dialysis with 30 μm InsP3) is plotted. Note that ICRAC was clearly submaximal in the presence of 0.6 mm EGTA. Each point is the mean ±s.e.m. of at least 5 cells. B, recordings are shown for a cell dialysed with 30 μm InsP3 and 0.6 mm EGTA (•) and for one dialysed with this solution but supplemented with 2 μm thapsigargin, a SERCA blocker (○). Note the increase in the size of ICRAC following inhibition of the pumps. C, the amplitudes, delays and times to peak are summarised for experiments as in B. Filled circles denote InsP3+ 0.6 mm EGTA whereas open cirlces represent InsP3+ 0.6 mm EGTA + thapsigargin.
