
Figure 3. Effect of exogenous surfactant and saline on γ of UAL.
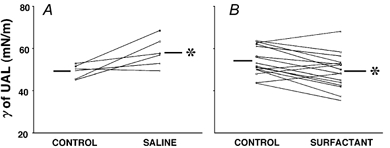
Individual data for γ of UAL under control vs. saline (A) and control vs. surfactant (B) conditions. Note that increases in γ of UAL occurred in the majority of rabbits with saline, while decreases occurred in most rabbits with surfactant. Different lines represent individual rabbits. *P < 0.05vs. control. Bars represent group mean values.