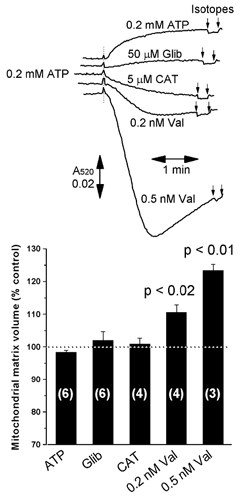
Figure 3. Changes in light scattering of heart mitochondria induced by ATP and CAT are not accompanied by changes in isotopically measured matrix volume.

Heart mitochondria were incubated under the same conditions as described for Figs 1 and 2, but using both sample and reference cuvettes of the spectrophotometer as described under Methods. After 1 min incubation in the cuvette the indicated reagent was added to the mitochondrial suspension in the sample cuvette only, and after a further 2 min 3H2O and [14C]sucrose were added to both cuvettes, and matrix volumes were determined as described under Methods. In the bar graph, the changes in matrix volume induced by the reagent added are expressed as the percentage of the volumes in the absence of reagent (reference cuvette). Data are presented as the means ±s.e.m. (error bars) of the number of experiments shown, each performed with a separate mitochondrial preparation. When CAT (10 μm) was added, 0.2 mm ATP was present in both the sample and reference cuvettes from the start of the incubation. The mean control matrix volume (reference cuvette) for the total of six mitochondrial preparations represented was 1.26 ± 0.10 μl (mg protein)−1. Glib, glibenclamide; Val, valinomycin.
