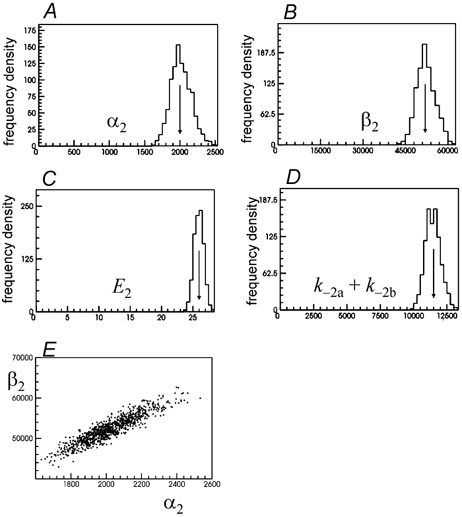
Figure 3. Distribution of estimates of rate constants, and of quantities derived from them, for 1000 fits to experiments simulated as in Table 1 (starting from ‘guess 2’).

The arrows mark the true values of the rate constants. Each ‘experiment’ consisted of about 9000 transitions at a single low concentration, 30 nm, of ACh. The constraints in eqns (9) and (10) were true for the mechanism used for simulation, and were applied during the fit. In these fits k+1a=k+2a was fixed arbitrarily at 1 × 10⁸m−1s−1, half its true value. Distribution of 1000 estimates of A, α2; B, β2; C, E2=β2/α2; D, k−2a+k−2b. The graph in E shows the 1000 pairs of α2 and β2 values plotted against each other to show the positive correlation between them (r=+0.916, see Table 3).
