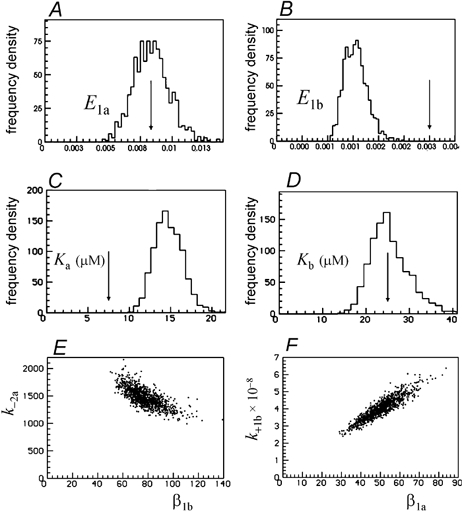
Figure 5. Distributions of equilibrium constants for the same fits as in Figs 3 and 4.

A–D, distributions of the four equilibrium constants (E1a, E1b, Ka, Kb) that refer to the two separate sites, calculated from the fitted rate constants (as shown Figs 3 and 4). The arrows mark the true values of the rate constants. E, the negative correlation between k−2a(=k−1a) and β1b; F, the positive correlation between k+1b (=k+2b) and β1a.
