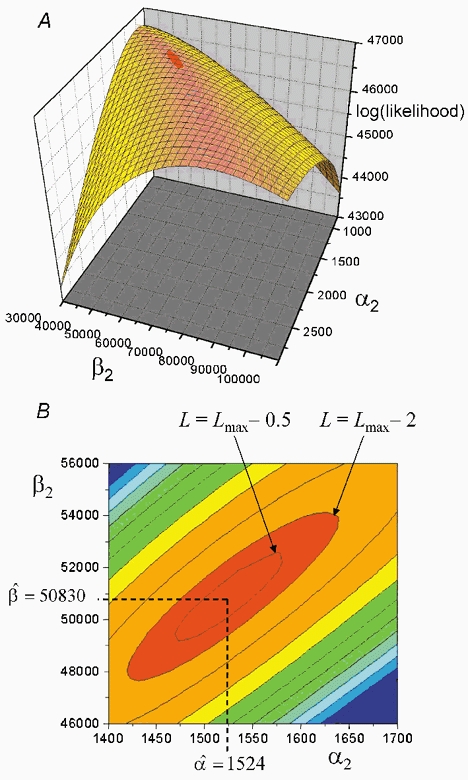
Figure 12. The shape of the likelihood surface near its maximum.

A, the surface shows the likelihood for various values of the shutting rate α2, and the opening rate β2, for the doubly occupied receptor. In order to plot this surface, the seven other free parameters were fixed at their maximum likelihood values, and the likelihood was calculated for various values of α2 and β2. B, contour representation of the surface shown in A, near the maximum. Dashed lines show the coordinates of the maximum point, the maximum likelihood estimates being α2= 1524 s−1 and β2= 50 830 s−1. The contours are shown also for log(likelihood) values of L=Lmax− 0.5 and L=Lmax− 2.0.
