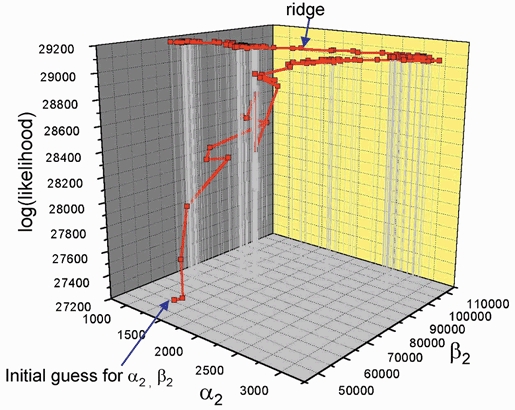
Figure 13. The progress of fitting in one example.

The likelihood (vertical axis) that corresponds with the values of α2 and β2 that are reached at various stages during the fitting process - notice the final crawl along a diagonal ridge near the maximum. Along the ridge, the values of α2 and β2 change roughly in parallel (so the efficacy, E2=β2/α2, does not change much), and the likelihood increases only slowly.
