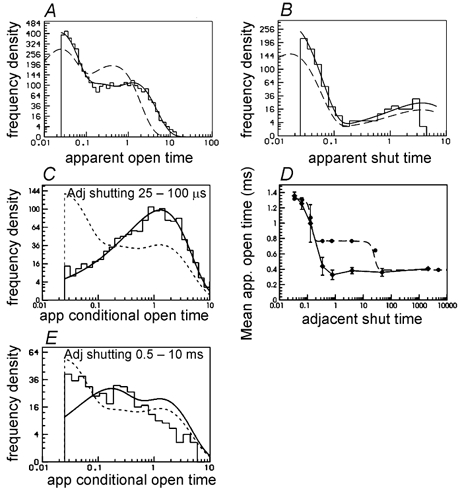
Figure 14. Predicted fits to a simulated experiment, when the fit assumed, incorrectly, that the two sites were independent.

A single low concentration of ACh (30 nm) was used, with EC50 constraint and fitted in bursts. The rate constants used for simulation are in Table 1 (labelled ‘true 2’), but the fit applied the constraints in eqns (9) and (10). A and B, predicted fits to apparent open and shut time, as in Fig. 6. C, conditional distribution of open times for apparent openings that are adjacent to the shortest shut times (25 - 100 μs). D, observed and predicted conditional mean open time plot (as in Fig. 6D and Methods). E, as in C but for apparent open times that are adjacent to shut times in the range 0.5–10 ms.
