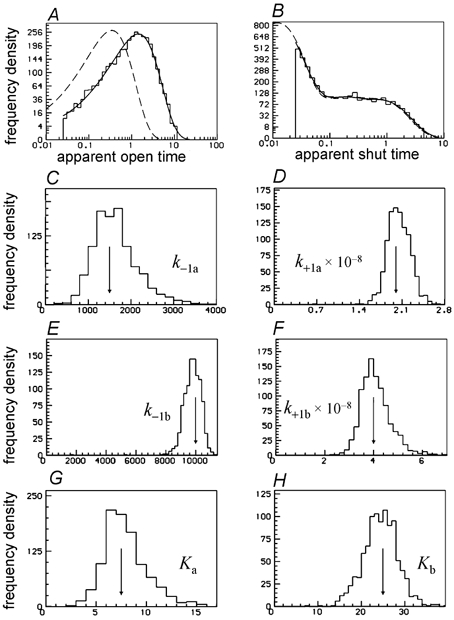
Figure 16. Analysis of 1000 fits to simulated experiments at a single high (10 μm) concentration of ACh.

The arrows mark the true values of the rate constants. A, apparent open times from a single simulated experiment, with the HJC distribution predicted by the fit superimposed on the histogram (resolution 25 μs); the dashed line is the predicted true distribution. B, apparent shut times (up to tcrit= 5 ms) as in A. C–F, distributions of 1000 estimates of the association and dissociation rate constants. G–H, distributions of the 1000 estimates of the microscopic equilibrium constants, Ka and Kb, for binding to the two sites (calculated from the fitted rate constants).
