
Figure 17. Non-independent sites.
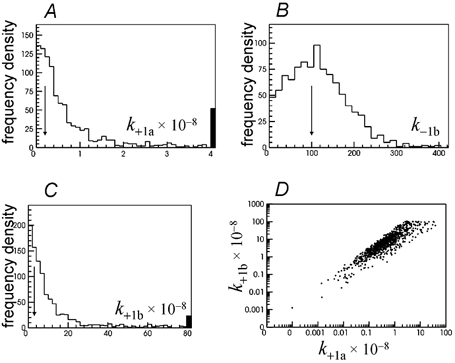
Estimates of k+1a (A), k−1b (B) and k+1b (C) from 1000 simulated fits using simultaneous fit of three concentrations of ACh (10 nm, 30 nm and 100 nm), with a resolution of 10 μs. All three records were fitted in bursts (tcrit= 3.5 ms), using CHS vectors. D, plot of the estimate of k+1b against that of k+1a from the same fit (an upper limit of 1010m−1 s−1 was placed on association rate constants in these fits). The arrows mark the true values of the rate constants.