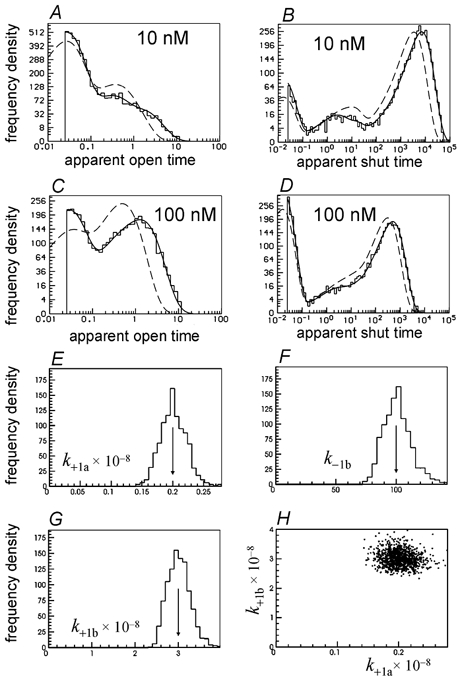
Figure 18. Non-independent sites.

Illustration of the prediction of the distribution of apparent open and shut times by the rate constants estimated by a single simultaneous fit to two low concentration of ACh (10 nm and 100 nm) simulated experiments. In this case it was assumed that one channel was present throughout both records so the entire shut time distribution is fitted (B and D). The two sites were not assumed to be independent in this case, and good estimates were obtained for all 13 free rate constants (see text). In particular the three rate constants which could not be estimated when the number of channels was not assumed (Fig. 17A–C) are now estimated well (E–G), and the estimates of k+1a and k+1b are now essentially uncorrelated (H). The arrows mark the true values of the rate constants.
