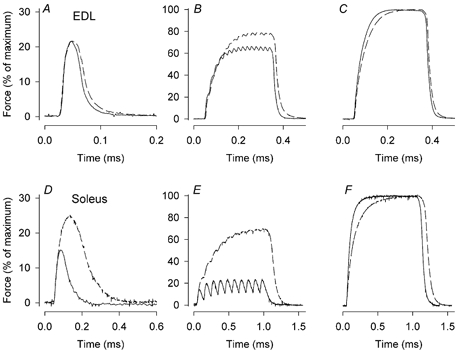
Figure 1. Soleus muscles of TRα1−/−β−/− mice are markedly slower than controls, whereas the difference in EDL muscles is small.

Typical force records from an EDL muscle (A-C) and a soleus muscle (D-E) of a wild-type (continuous lines) and a TRα1−/−β−/− (dashed lines) mouse. Records are from twitches (A and D), intermediate frequency tetani (50 Hz for EDL (B) and 10 Hz for soleus (E)) and maximal tetani (150 Hz for EDL (C) and 100 Hz for soleus (F)). Note that twitches are shown on expanded scales.
