
Figure 5. Effect of U-73122 on the Ca2+ responses of GH3 cells.
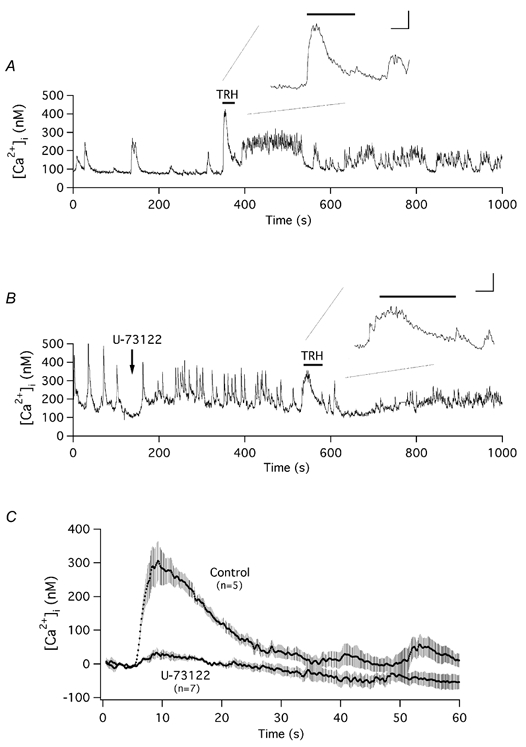
A and B, time course of variation in [Ca2+]i in two representative cells and their response to TRH addition in the absence (A) or the presence (B) of 10 μm U-73122. Measurement of [Ca2+]i in Fura-2-loaded cells was performed as described in Methods. Addition of U-73122 to the recording chamber and the period of perfusion with 100 nm TRH are indicated. Expanded fragments of the [Ca2+]i recordings during perfusion of TRH are shown in the insets. Note the contribution of two precedent spontaneous Ca2+ oscillations to the otherwise quite small Ca2+ elevation induced by TRH entry in B. Inset calibration bars correspond to 100 nm Ca2+ and 10 s. C, averaged recordings of [Ca2+]i showing the initial TRH-induced Ca2+ transients in the absence (Control) or presence of U-73122. Data traces synchronized to the moment of TRH addition were averaged point by point and averaged values ±s.e.m. are shown. Averaged [Ca2+]i values in the first point of the recordings have been subtracted from the data. Numbers in parentheses indicate the number of cells from which averaged data were obtained.