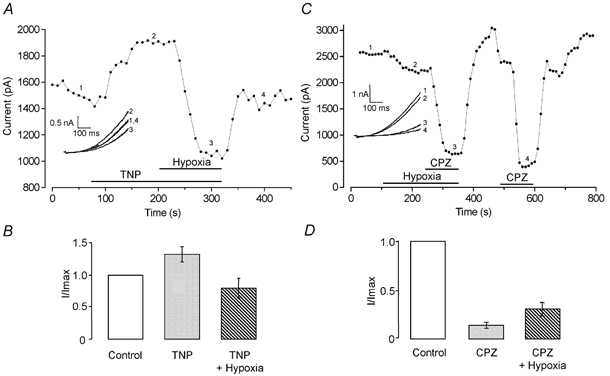
Figure 3. Hypoxia occludes modulation of hTREK-1 by chlorpromazine and trinitrophenol.

A, typical time series plot of current amplitude measured at +60 mV showing the effects of TNP in normoxia, and the complete reversal of its effects by hypoxia. Periods of exposure to TNP and hypoxic perfusate indicated by the horizontal bars. Numbered current traces in the inset correspond to the numbered points on the time series. B, mean, normalised current amplitudes recorded at +60 mV in control (normoxic) solutions and in the conditions indicated beneath each bar. C, typical time series plot of current amplitude measured at +60 mV showing the effects of hypoxia and of CPZ in the presence and absence of hypoxia. Periods of exposure to CPZ and hypoxic perfusate indicated by the horizontal bars. Numbered current traces in the inset correspond to the numbered points on the time series. D, mean, normalised current amplitudes recorded at +60 mV in control (normoxic) solutions and in the conditions indicated beneath each bar.
