
Figure 3. Fast and slow effects vary with tone frequency and intensity, and with the time course of efferent stimulation.
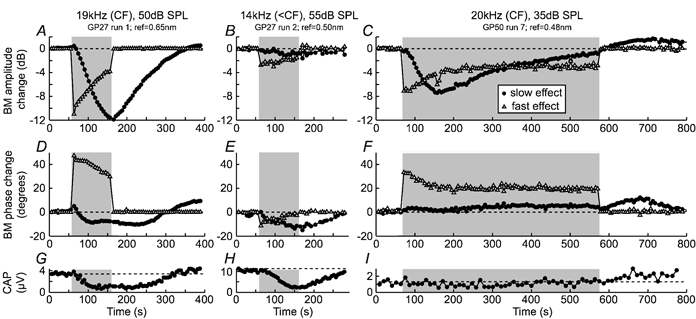
BM vibration amplitude (A-C) and phase (D-F) changes attributed to fast (▵) and slow (•) effects are shown for three runs of the single-tone paradigm (cf. Fig. 1B). Stimulus details and reference vibration levels for 0 dB amplitude changes are indicated at the top. Shading indicates the overall period of efferent stimulation (the test period; cf. Fig. 1 A). G-I, amplitudes of simultaneously recorded CAPs, illustrating the slow effects of the efferent stimulation on the auditory nerve.