
Figure 3. Shifts in the baroreflex curves for HR obtained during pre-exercise, treadmill exercise and the post-exercise periods.
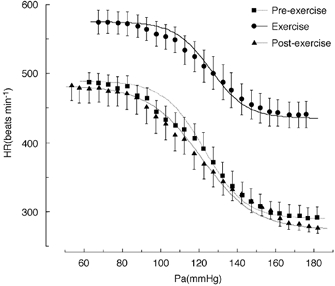
Curves reflect data averaged from 11 animals and symbols and bars indicate means ±s.e.m., respectively, estimated over each 2.5 mmHg bin of Pa.