
Figure 4. Shifts in the baroreflex curves for RSNA and HR observed during pre-sham exercise, sham exercise and post-sham exercise periods.
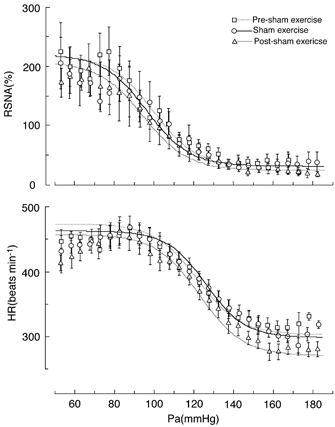
Sham exercise was carried out by placing a plate above the treadmill lane such that rats were exposed to exactly the same conditions of treadmill exercise except that there was no running. Curves reflect data averaged from 11 animals and symbols and bars indicate means ±s.e.m., respectively, which were averaged over each 2.5 mmHg bin of Pa.