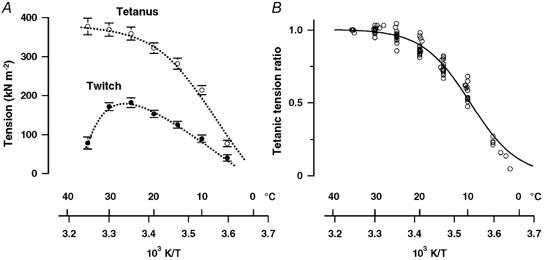
Figure 3. Temperature dependence of twitch and tetanic tensions.

A, mean ±s.e.m. twitch tension (filled symbols) and tetanic tension (open symbols) from eight preparations. Tension per cross-sectional area is plotted on the ordinate and reciprocal absolute temperature on the abscissa. (Note that data for 5 °C and below are from three fibre bundles only.) The twitch tension increases linearly with temperature in the range 5–25 °C but declines at higher temperatures. Tetanic tension increases with increase of temperature, but the increase is less marked between ∼25 and 35 °C. B, tetanic tension data in A are plotted after normalisation to that at 35 °C. The relationship between tetanic tension and reciprocal temperature is approximately sigmoidal with half-maximal tension occurring at 9.5 ± 0.2 °C. The data at temperatures < 5 °C, however, are not well fitted to the curve.
