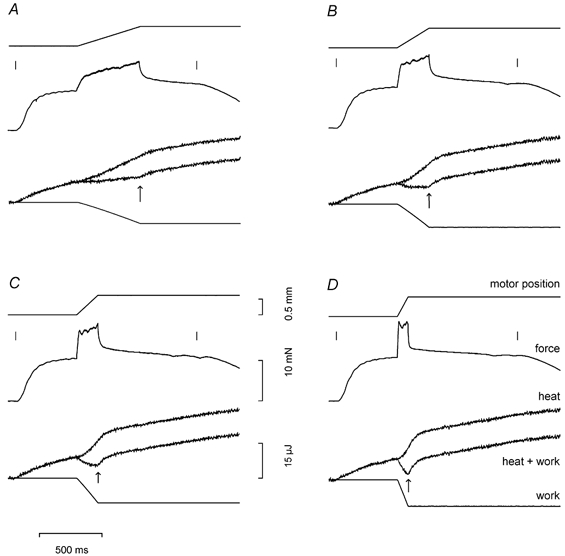
Figure 3. Time course of energy during steady lengthening at different velocities.

Each panel shows from top to bottom: motor position, force, heat, energy (heat + work) and work for tetani with stretch at different velocities (L0 s−1): A, 0.185; B, 0.364; C, 0.532; and D, 1.09. Short vertical lines mark the beginning and the end of the stimulation. The vertical arrow on each energy trace marks the end of stretch. Same fibre as in Fig. 1.
