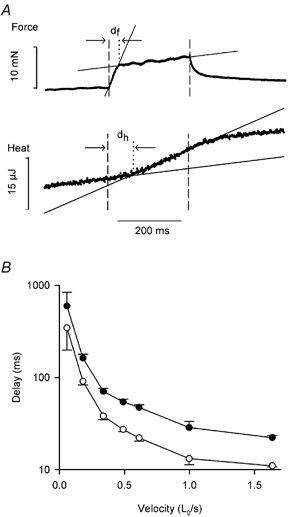
Figure 4. Time to change in rate of force and heat production during stretch.

A, method of measuring the time to change in rate of force (df) and heat production (dh). Vertical dashed lines mark the start and end of stretch. Continuous lines are fits through the data points. The vertical dotted line marks the time of intersection of the fitted lines. Velocity of stretch: 0.364 L0 s−1. B, relationship between df (○), dh (•) and velocity of stretch. Note the delay axis is log scale. Means ±s.e.m., n values vary between 2 and 10. Results for 6 fibres and 44 tetani.
