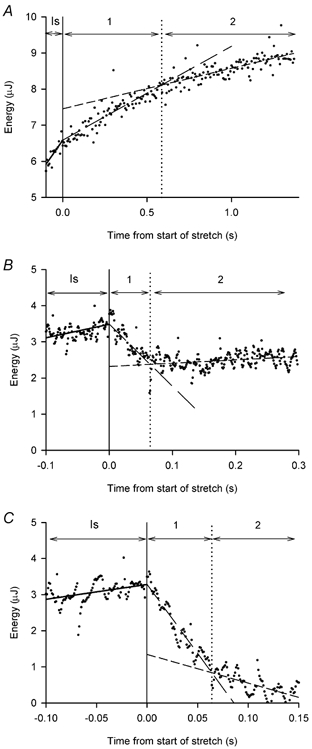
Figure 6. Examples of phases in the energy record during stretch.

Records of energy (dots) vs. time for 3 tetani with stretch at different velocities (L0 s−1): A, 0.066; B, 0.50; C, 1.0. The continuous vertical line marks the end of the isometric period and the start of stretch, time = 0. Isometric values were measured during the period labelled Is. Phases 1 and 2 during stretch are marked 1 and 2, respectively. Straight lines were fitted through the isometric points (continuous lines) and the two phases of energy change during stretch (dashed lines) as described in the Methods. The dotted vertical line marks the intersection of the lines fitted to the energy during stretch (end of phase 1 and start of phase 2).
