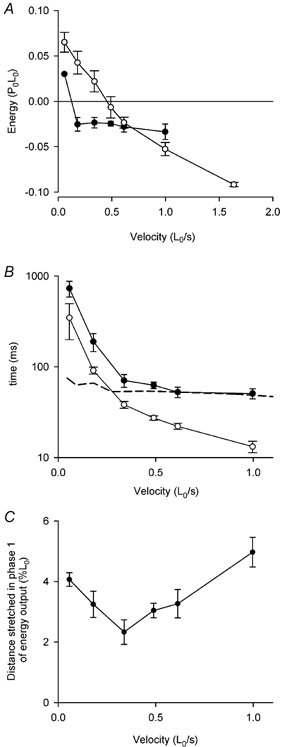
Figure 7. Two phases of energy change during stretch.

A, the amounts of energy change during phase 1 (•) and phase 2 (○) of stretch at different velocities. See Fig. 6 and text. Means ±s.e.m., n = 2–11. Results for 6 fibres. B, the time to the end of phase 1 (•) and the delay to the change in slope of force (○, same as Fig. 4B) during stretch at different velocities. Note that the time axis is log scale. Means ±s.e.m., n = 2–10. Results for 6 fibres. The dashed line shows the predictions from the model of the time to reach the steady state distribution of crossbridge states during stretch. C, the distance stretched during phase 1. Means ±s.e.m., n = 2–9. Results for 6 fibres.
