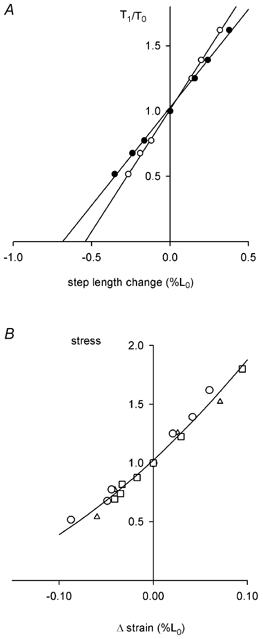
Figure 9. Tendon compliance.

A, results for one fibre showing the values of force (T1) recorded at the end of a step change in fibre length expressed relative to the force before the step (T0) vs. the step length change produced by the motor (•) and the change in sarcomere length detected by the striation follower (○). Length change is expressed relative to the length before the step change. See text for further explanation. L0, 5.61 mm; P0, 5.84 mN; sarcomere length at L0, 2.11 μm; segment length under the striation follower, 1.20 mm; average segment sarcomere length, 2.10 μm; cross-sectional area, 18 300 μm2; temperature, 4.8 °C. B, stress vs. strain relationship for the tendon. Stress is the value of T1/T0 shown in A. Δ strain is the change in length of the tendon, expressed relative to L0. Δ strain is the difference between motor movement and change in sarcomere length (difference between • and ○ in A). Results for 3 fibres shown as different symbols. P0, 4.21 ± 0.56 mN; fibre cross-sectional area, 15 900 ± 1300 μm2; and temperature, 4.2 ± 0.3 °C.
