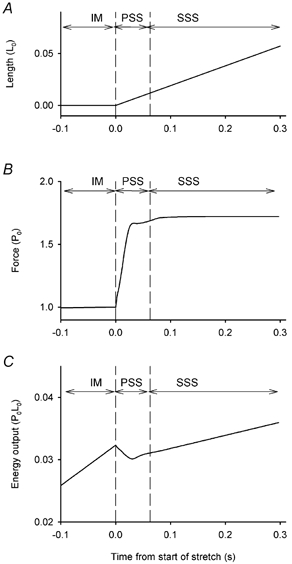
Figure 11. Energy storage during lengthening and model predictions.

A, total energy change vs. velocity of stretch. Continuous line, no points: total predicted energy from ATP hydrolysis and energy absorption. •, observed energy, means ±s.e.m., n values vary from 2 to 11. B, energy change vs. velocity of stretch. Energy change observed during phase 1 (symbols are means ±s.e.m., n values vary from 2 to 9) and energy absorption predicted to occur in the period before the steady state distribution of crossbridge states is reached (dashed line).
