
Figure 1. Estimate of the amount of ouabain bound to specific sites.
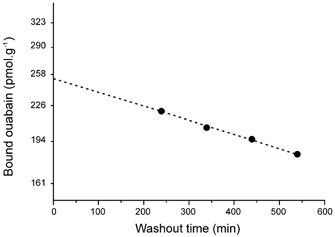
The experimental points show a semilog plot of the slow monoexponential component of the release of ouabain (labelled with [3H]ouabain) from a muscle that had been exposed to the drug for 40 min. The extrapolation to time zero represents the amount of ouabain bound to specific sites (pumps) at the end of the exposure. Most of the initial points of the washout (not shown) fall out of range and represent the release from the extracellular space and non-specific binding sites.