
Figure 1. Four types of spatial selectivity of colour-coded neurons.
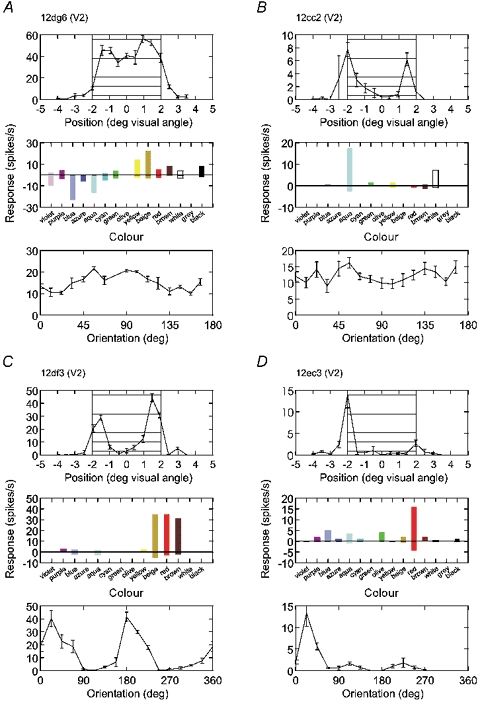
A–D, examples of neurons from area V2. For each neuron, edge selectivity, colour selectivity and orientation tuning is illustrated. In each panel, the top graphs represent the activity produced by static displays of a 4 deg square of preferred colour presented at 16 positions relative to the receptive field. Hatching indicates the range where the receptive field centre was inside the square or centred on the edges (positions −2 and +2). The middle bar graphs represent responses to flashing bars of various colours, as indicated on the abscissae. Colours of high and low luminance were tested for each chromaticity (hue), for example, violet and purple, blue and azure, etc., and the three achromatic colours white, grey and black. On-responses are plotted upwards, off-responses downwards. The bottom graphs show orientation tuning curves obtained with a bar 2 deg × 0.2 deg (A and B) or with the edge of a 4 deg square (C and D). The cell in A responds to the surface, the cells in B–D only to the edges of the square; those in A and B are non-oriented, those in C and D are orientation selective; those in B and C respond to both edges, that in D is selective for edge contrast polarity. In this figure and in Figs 2 and 3, the numbers at the top of each panel are unit identification codes with cortical area assignment.