
Figure 6. Colour and orientation selectivity.
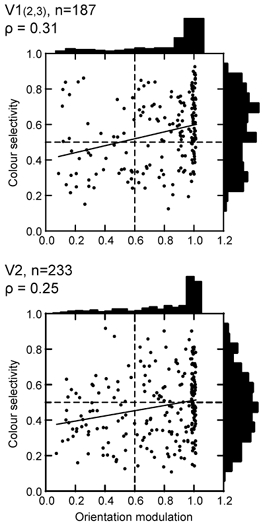
The colour selectivity index is plotted as a function of the orientation modulation index. Dashed lines show criterion values. Continuous lines represent least-square fits. Note that non-oriented colour cells (top left) and oriented non-colour cells (bottom right) are no more frequent than oriented colour and non-oriented non-colour cells (top right and bottom left, respectively). The vast majority of colour-coded cells are orientation selective (top right).