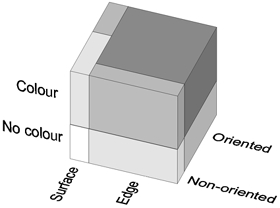
Figure 11. Schematic representation of the contingencies of colour-, orientation- and edge selectivity for layers 2 and 3 of V1.

The number of cells with each combination of selectivity is represented by the volumes of the compartments of the contingency cube. Darker shading indicates higher selectivity. The darkest block, for example, represents orientation- and edge-selective colour cells (46 % of the total number); the medium grey block at the front top right represents non-oriented edge-selective colour cells (10 %). Note that the top and bottom parts of the cube have the same ground plan, that is, the relative frequencies of the four combinations of orientation- and edge selectivity are the same for colour-coded and non-colour-coded cells. The result for V2 was similar except for a slightly lower incidence of colour selectivity. This ‘factorial’ scheme of representation is contrary to previous reports suggesting that the visual cortex strives to separate colour and form information.
