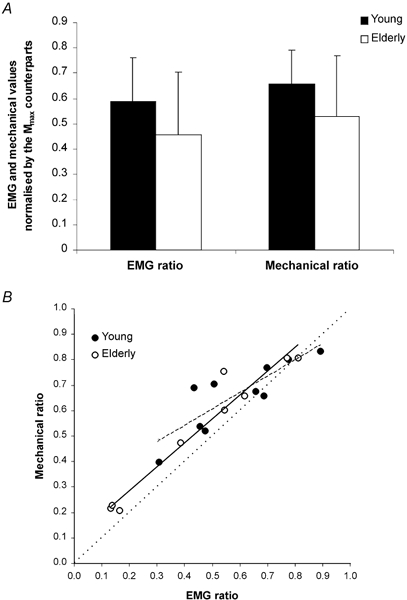
Figure 5. Electromyographic (EMG) ratio and mechanical ratio in young and elderly subjects.

A, the amplitude of the columns correspond to the values of the EMG ratio (Hmax/Mmax ratio) and the mechanical ratio (the ratio between the twitch torque associated with Hmax and the peak twitch associated with Mmax) for the young (n = 10, ▪) and elderly subjects (n = 9, □). No statistical differences were observed between the two groups and within ratios. B, the individual values of the mechanical ratio are plotted against EMG ratio measurements. •, data points for young individuals; ○, individual values for the elderly subjects. A linear correlation was found between the two variables; the equations are y = 0.64x+ 0.28 (r = 0.82, P < 0.01) and y = 0.94x+ 0.10 (r = 0.97, P < 0.001) for the young and the older groups, respectively. The best-fit line is indicated by the continuous line for young subjects and the dashed line for older individuals. The dotted line marks the line of identity and corresponds to the values which would be achieved when the twitches evoked by either wave were equal for equal wave amplitudes. Data are presented as means ±s.d.
