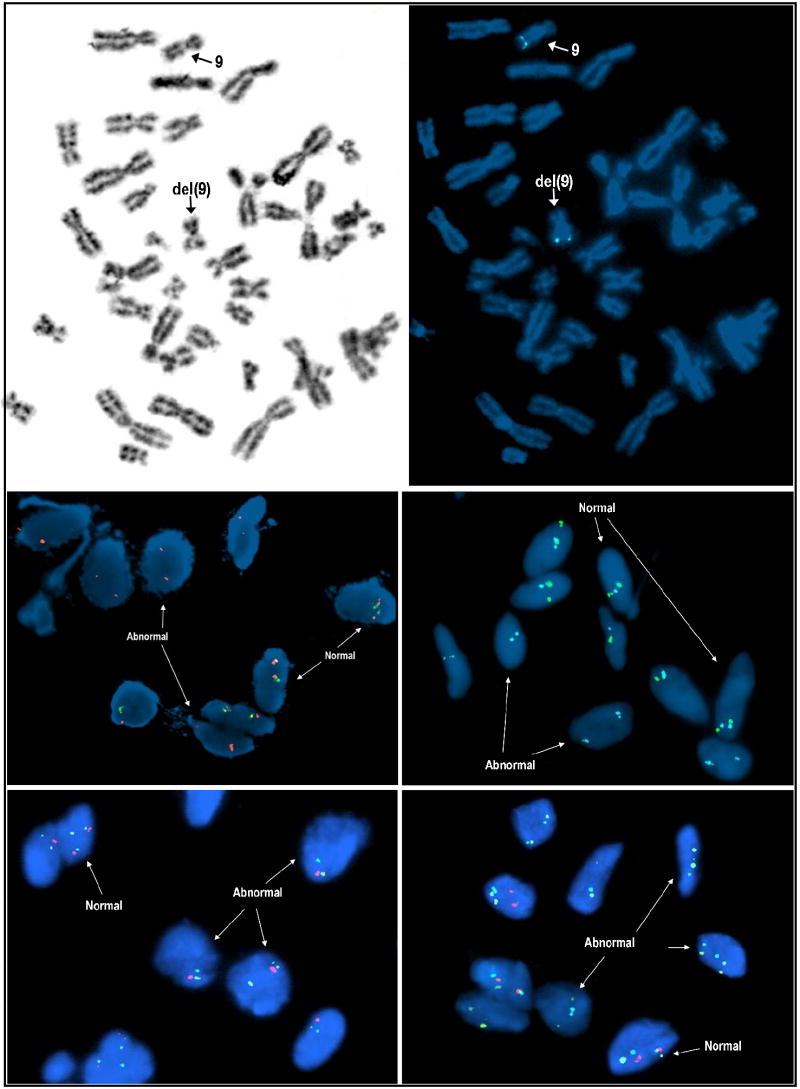
Figure 2.
Inverted DAPI metaphase cell image of Case 1 showing the cytogenetically deleted chromosome 9 (upper left). Bicolor FISH analysis with a PTCH1 gene locus (9q22.3) probe in red and ASS gene locus (9q34.1) in aqua shows loss of both PTCH1 gene loci including signal loss on the cytogenetially “normal-appearing” chromosome 9 homologue (indicated by “9” and arrow), (upper right). Bicolor interphase FISH analyses of cytologic touch preparations of Case 1 with the PTCH1 gene locus specific probe in green coupled with a chromosome 9 specific centromeric probe in orange and the PTCH1 gene locus specific probe in green coupled with the ASS gene locus specific probe in aqua confirms loss of both PTCH1 loci in abnormal tumor cells (middle left and right respectively). Case 2, tricolor FISH analysis performed on paraffin-embedded tissue sections using the following DNA probe set: CEP9 (green), PTCH1 locus (red), and ASS (aqua) shows loss of one set of chromosome 9 signals in a significant portion of cells (monosomy 9), (lower left). Using the same tricolor FISH approach described for Case 2, analysis of Case 3 revealed homozygous loss of the PTCH1 gene locus (red signal) in a significant portion of cells (lower right).

