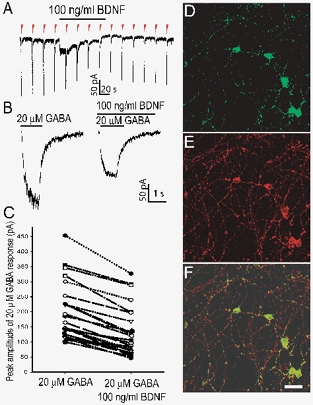
Figure 1. Acute exposure to brain-derived neurotrophic factor (BDNF) attenuates GABA-evoked whole-cell current in cerebellar granule cells.

A, representative penwriter record displays current responses evoked by a 1 s application of GABA (20 μm) delivered every 20 s as denoted by the red arrowheads. Exposure to BDNF (100 ng ml−1) (continuous line above the arrowheads) reduces the peak amplitude of GABA responses. Note the depolarizing current during acute BDNF exposure in this example. B, digitized traces recorded in the absence (left) and presence (right) of BDNF are shown in expanded time scale. C, scatter plot summarizing the change in peak amplitude of GABA responses upon exposure to BDNF monitored in 20 granule cells. Each pair of connected points represents data derived from one cell. Confocal images of cultured cerebellar granule cells stained with antibodies against TrkB receptor (D) and synaptophysin (E), using green and red fluorescence respectively. F, overlay of D and E. Scale bar = 20 μm applies to D, E and F.
