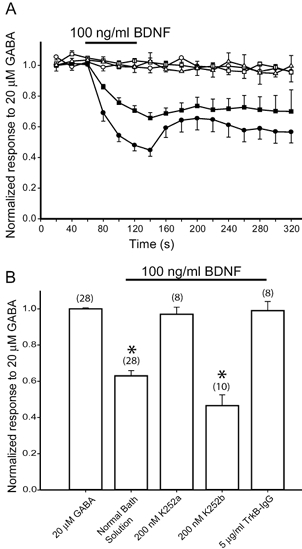
Figure 2. TrkB-IgG and K252a, but not K252b, prevent BDNF-induced reduction of GABA response.

A, peak amplitude of responses to GABA (20 μm) plotted as a function of time before, during and after exposure to 100 ng ml−1 BDNF. The continuous line denotes time and duration of BDNF application. GABA responses were monitored in normal bath solution without exposure to BDNF during recording (□), in normal bath solution with a 1 min exposure to BDNF (▪), and with added K252a (200 nm; ○), K252b (200 nm; •) and TrkB-IgG (5 μg ml−1; ▵). Each point represents data averaged from 8–10 cells. B, bar graph summarizing mean peak amplitude of GABA responses as a function of the conditions in A.
