
Figure 4. Exposure to BDNF decreases the amplitude and frequency of miniature IPSCs (mIPSCs).
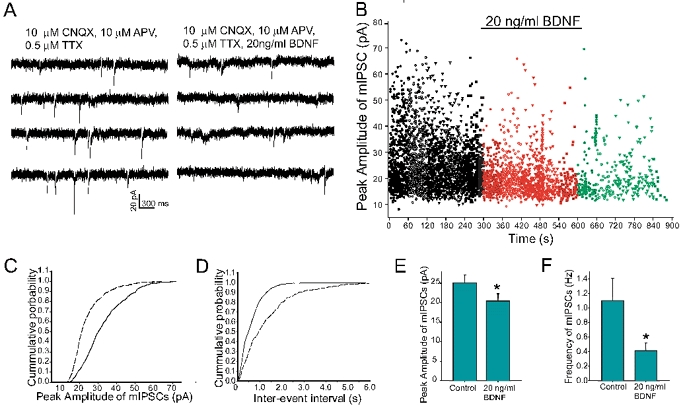
A, representative traces recorded in the presence of 10 μm CNQX, 10 μm APV and 0.5 μm TTX, without (lefthand traces) or with (righthand traces) BDNF (20 ng ml−1); holding potential −60 mV. B, peak amplitude of mIPSCs plotted as a function of time before, during and after exposure to BDNF. There are fewer large-size amplitude events during BDNF exposure (red dots) than during the control period (black dots). C, cumulative distribution of peak amplitude of mIPSCs in the presence of BDNF (dashed line) shifted leftward compared to that obtained under control conditions (continuous line). D, exposure to BDNF (dashed line) shifted rightward the cumulative distribution of inter-event interval of mIPSCs compared to that obtained under control conditions (continuous line). E and F, histograms summarizing data derived from 8 cells; exposure to BDNF decreased the mean amplitude (E) and frequency (F) of mIPSCs from 25.8 ± 2.1 to 20.4 ± 0.8 pA and 1.1 ± 0.3 to 0.41 ± 0.3 Hz, respectively. * Statistically significant (Student's paired t test, P < 0.05).