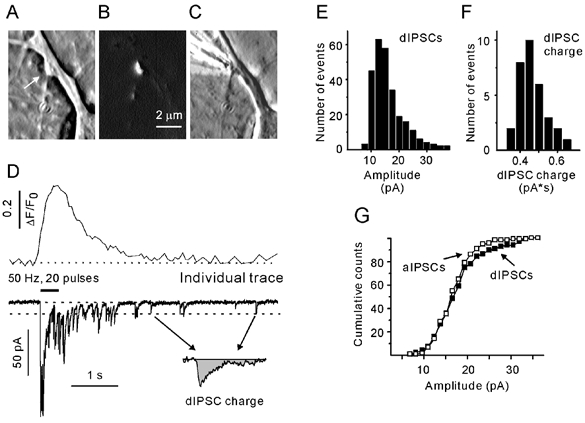
Figure 1. Simultaneous recording of presynaptic Ca2+ ([Ca2+]pre) transients and inhibitory postsynaptic currents.

Phase contrast (A) and FM4–64 images (B) of a single terminal (arrow). C, phase contrast image showing a stimulation pipette in close proximity to a terminal. D, single [Ca2+]pre transient and postsynaptic response induced by focal stimulation of a bouton with 20 standard pulses at 50 Hz. The dotted line at the current traces indicate the average amplitude of delayed IPCSs (dIPSCs). The origin of the arrows corresponds to dIPSCs selected for the calculation of dIPSC charge transfer (inset). E and F, amplitude histograms of dIPSCs (E) and dIPSC charge transfer (F). G, cumulative probability histograms of dIPSCs (filled) and asynchronous IPSCs (aIPSCs; open symbols). All data were obtained from the same synapse.
