
Figure 3. Transition into an asynchronous mode of transmission requires 10 pulses.
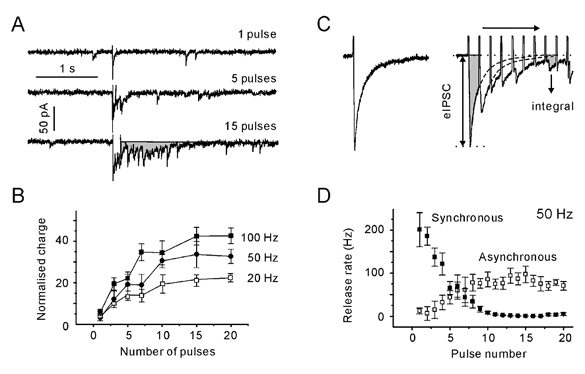
A, postsynaptic responses elicited with a single pulse and with 50 Hz trains of 5 and 15 pulses. The shaded area represents the delayed response. B, dependence of normalised charge transferred after the termination of stimulation on the number of pulses in a train. The delayed response was normalised to the mean charge of the dIPSCs. Note that regardless of the stimulation frequency, the transferred charge reaches a plateau after 10 stimuli. All data points are averages from five synapses. C, individual synchronous, evoked IPSC (eIPSC) and IPSCs evoked with a 50 Hz train. eIPSCs were assumed to decay with a typical single exponential time constant. The latter was determined by a single exponential fitting of the decay phase of pretetanic eIPSCs. eIPSCs were constructed using the eIPSC waveform as a template (dotted lines). The total evoked response was constructed by adding the contribution from each eIPSC. The reconstructed eIPSC response was integrated to obtain the synchronous charge transfer. The difference between the observed (shaded areas) and constructed current integrals represents the charge transferred by the asynchronous release. D, synchronous and asynchronous release rates during a 50 Hz stimulation. The release rates were obtained by dividing the synchronous/asynchronous charge per second by the mean charge of the dIPSC. Data points are averages from five synapses. Note that the frequency of asynchronous release reached a steady state after 10 pulses.