
Figure 6. [Ca2+]pre responses exhibit a non-linear dependency on stimulation frequency.
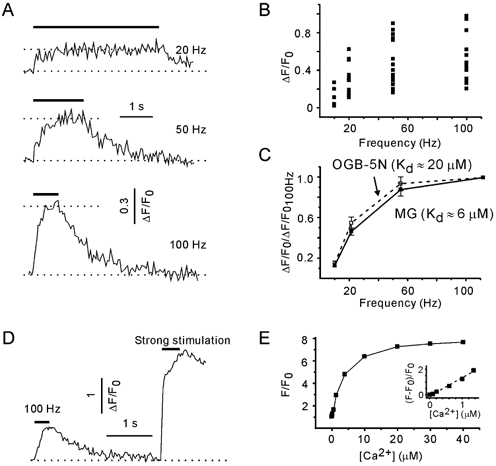
A, examples of [Ca2+]pre transients induced with 20, 50 and 100 Hz trains. Data from the same synapse. [Ca2+]pre transients were visualised using Magnesium Green (MG). B, interbouton variability of [Ca2+]pre responses. Data obtained from 13 presynaptic terminals. C, dependence of [Ca2+]pre plateau levels on the stimulation frequency. For each synapse, [Ca2+]pre responses were normalised to the peak amplitude of [Ca2+]pre at 100 Hz. Same data as in B. Oregon Green 488 BAPTA-5N (OGB-5N), a Ca2+ probe with lower affinity, did not modify the frequency dependence (five boutons). D, a train of stronger pulses induced a much larger (although irreversible) elevation of presynaptic fluorescence than a 100 Hz train with standard pulses. E, calibration curve for MG. Calibration was performed in vitro using droplets of solutions containing 10 μm MG-K5 and variable Ca2+ concentrations. F0 is the fluorescence of MG in Ca2+-free solution. Inset, expansion of the lower part of the curve with a modified y-axis. Note the linear relationship between ΔF/F0 and [Ca2+] (dotted line).