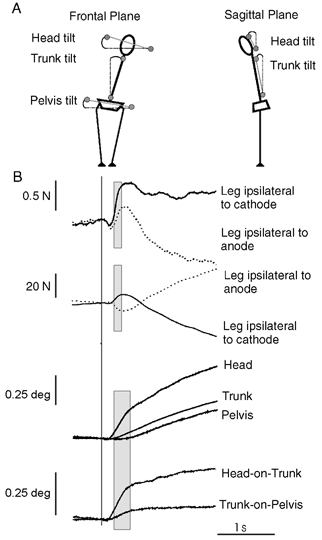
Figure 1. Definition of kinematic measures and responses seen in control conditions.

A, definition of the angles measured (circles indicate the position of the markers used). Subjects are shown schematically from behind in the frontal plane and from the left side in the sagittal plane. B, group mean control (no loading) response taken from experiment 2. From top to bottom: lateral reaction forces, vertical forces, frontal plane segment tilt and relative segment tilt. Reaction forces acting on the foot on the side of the stimulating anode or cathode are shown. Traces have been aligned to stimulus onset indicated by the vertical line. Shaded boxes indicate the regions over which linear regression was performed.
