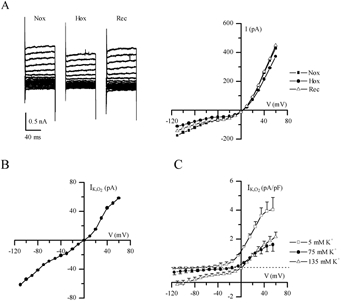
Figure 3. Electrophysiological properties of the background hypoxia-sensitive K+ current (IK,O2) in GPN neurones.

A, traces show a representative example of background or ‘leak’ currents before (Nox), during (Hox) and after (Rec) hypoxia, recorded in symmetrical high K+ solution (135 mm) containing TTX (1 μm), 4-AP (5 mm), TEA (30 mm) and Ni2+ (2 mm; substituted for Ca2+), during various voltage steps from −100 to +70 mV. Corresponding I-V plots are shown on the right. B, I-V plot shows a representative example of the hypoxia-sensitive ‘difference’ current (IK,O2), obtained by subtracting the current density during hypoxia from that during normoxia (see A). C, IK,O2 current density was obtained from groups of cells at three different extracellular K+ concentrations as follows: 5 mm (n = 4), 75 mm (n = 4) and 135 mm (n = 7); note that for each case the reversal potential of IK,O2 was similar to that predicted by the Nernst equation for K+ (i.e. −80, −14 and 0 mV, respectively).
