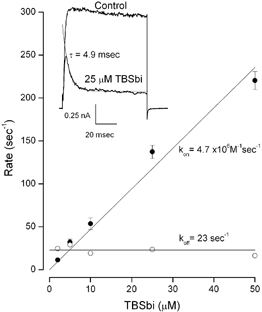
Figure 3. On- (•) and off- (○) rates for TBSb block in 135 mm internal K+.

Mean values with s.e.m. limits from 4–7 measurements at each TBSb concentration. Lines: linear fits with kon and koff values of (4.7 ± 0.15) × 106m−1 s−1 and 23 ± 1.3 s−1. Inset: raw data records in the absence (Control) and presence of 25 μm internal TBSb. Thin line: exponential fit to TBSb data with a time constant of 4.9 ms.
