
Figure 3. Spontaneous single-channel currents recorded in isolated outside-out patches.
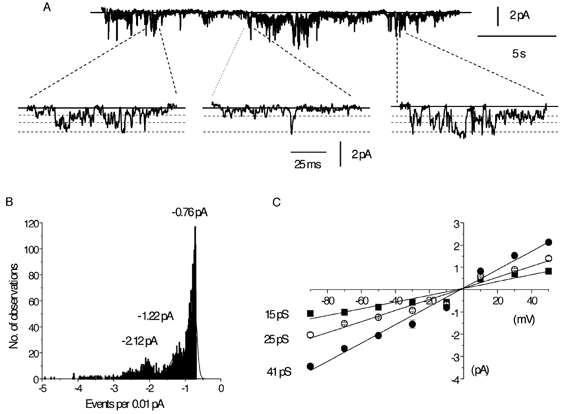
A, spontaneous single-channel activity at −50 mV on different gains and time scales. Amplified traces were selected to illustrate the direct transitions between all three open levels. B, amplitude histogram giving three unitary current amplitudes from the same cell used in A, at −50 mV; note that the smallest is the most commonly observed level. Note also that there are multiple openings, indicating that there is more than one channel in the patch. C, mean I–V relationship of the three current levels and each point is the mean of 5–24 patches.