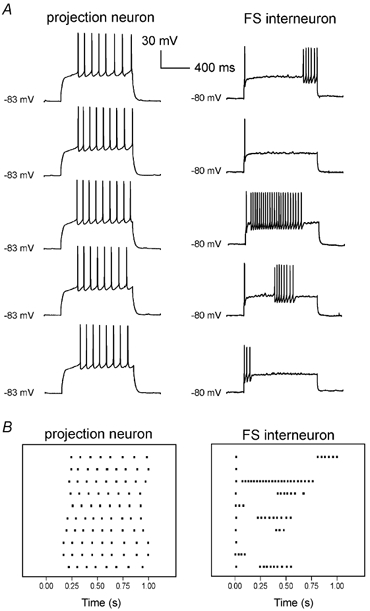
Figure 2. Comparison of firing properties of a projection neuron and a FS interneuron.

A, effects on membrane potential of equal steps of current (400 pA for the projection neuron and 200 pA for the FS interneuron) injected every 45 s from the resting level (no current injected). Resting membrane potential was −83 mV for the projection neuron and −80 mV for the FS interneuron. B, raster plots (time aligned with traces in A) indicating the timing of occurrence of action potentials in the two neurons over 10 consecutive trials (each of which is represented by a horizontal array). The horizontal axis represents time after the start of the depolarising step. Each dot represents an action potential.
