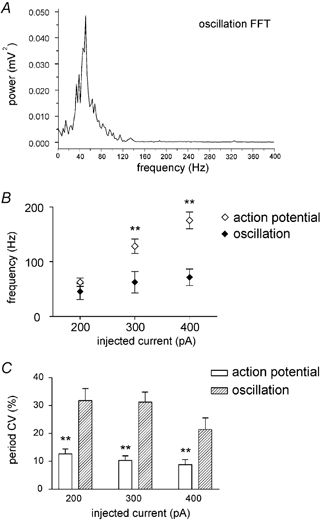
Figure 4. Quantitative features of membrane potential oscillations.

A, average fast Fourier transform (FFT) of the oscillations induced in a FS interneuron by 200 pA injections (the average FFT was obtained from individual FFTs of the oscillations elicited by 12 consecutive current injections; 4096 data points). B, average dependence of action potential and oscillation frequency on the amount of positive current injected intracellularly. C, coefficient of variation (CV) of action potential and oscillation period as a function of the injected current. **Statistically significant difference (P < 0.001).
