
Figure 7. Comparison of subthreshold voltage trajectories for the first and subsequent spikes in a burst.
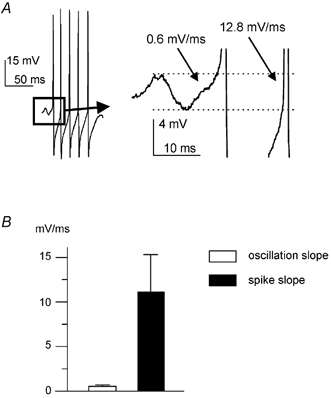
A, in this typical example, the depolarising trajectory in the voltage range in which the oscillations took place is compared for the first spike in a burst and for the subsequent ones in a FS interneuron. The trace on the right is an enlargement of the portion of the left trace enclosed in the box. B, plot of the average value of the depolarisation rate for the first spike (open bar) and for the subsequent spikes (black bar).